
 Seonglae Cho
Scout Realtime
sudo apt install rubygems
sudo gem install scout_realtime
sudo scout_realtime -p 55555
How to Monitor Linux Server and Process Metrics from Browser
In the past, we've covered lots of command-line-based tools for monitoring Linux performance, such as top, htop, atop, glances, and more, and a number of web-based tools such as cockpit, pydash, linux-dash, just to mention but a few. You can also run glances in web server mode to monitor remote servers.

https://www.tecmint.com/monitor-linux-server-in-realtime/
scoutapp/scout_realtime
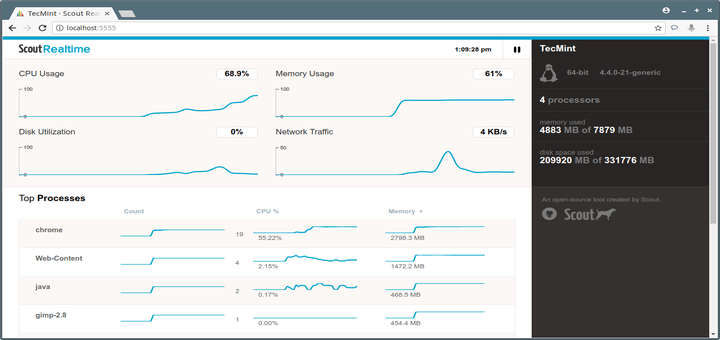
Stream realtime server and process metrics to your browser! On the server you want to monitor: install the gem: gem install scout_realtime start the daemon: scout_realtime start On your local computer: create an SSH tunnel to your server: ssh -NL 5555:localhost:5555 user@ip_or_hostname (where user@ip_or_hostname is the same as you usually use to SSH to your server) Point your browser to http://localhost:5555 When you're done, you can stop the daemon with: scout_realtime stop Scout realtime is a better top command: it gives you disk, memory, network, CPU, and process metrics.
https://github.com/scoutapp/scout_realtime
Scout APM
ScoutAPM Python Agent. Supports Django, Flask, and many other frameworks. ScoutAPM Ruby Agent. Supports Rails, Sinatra, Grape, Rack, and many other frameworks ScoutAPM Agent for NodeJS. Supports Express and other frameworks MIT 0 Updated 1 0 0 Apr 12, 2021 MIT 0 Updated 1 4 0 Feb 23, 2021 MIT Updated 9 13 4 1 Feb 23, 2021 ScoutAPM Elixir Agent.
https://github.com/scoutapp

Application Monitoring for Ruby, PHP, Node.js, Python, and Elixir ~ Scout
Rails Monitoring, Django Monitoring, Elixir Phoenix Monitoring, PHP Laravel Monitoring, and more that identifies slow database queries, memory leaks, and slow custom code.

https://scoutapm.com/