 Seonglae Cho
Inference time Local graph
Visualize causal flows between features. Due to thousands or tens of thousands of edges being generated in the attribution graph, we only keep the paths that "contribute most significantly" to the model output (logit).
Nodes
The graph contains Embedding nodes, Feature nodes, Error nodes, and Logit nodes. Edges indicate direct contributions calculated as source node value × (linear) weight. Edge weights are categorized into two types: Residual-direct paths and Attention-mediated paths, distinguishing between connections through residual connections versus those through attention and OV circuits. In the Local graph, the original model's attention patterns(QK) are frozen to include the OV(output→value) stage, allowing us to track "which token positions, through which features, contributed to which token predictions." This enables visualization of how specific attention heads move information to particular features in a given prompt.
In contrast, the global graph only measures residual-direct paths (CLT decoder→residual→CLT encoder) since attention patterns (QK) change with every context. Attention-mediated paths are excluded from global analysis because they vary depending on the context.
Importance Score from Influence matrix
Let be the normalized absolute value Adjacency matrix containing "first-order (direct edge) influences". We can model the cumulative contributions of all causal interactions between graph nodes through paths of length k. Using Neumann series, (Reachability Matrix)
The final influence matrix excluding self-influence can be calculated as follows:
Attribution Graph Pruning
- Create matrix A by taking absolute values of direct contributions (edges) between nodes (token embeddings, features, error nodes) and normalizing so incoming edges to each node sum to 1.
- Calculate indirect contributions using , where B contains the summed influence of paths of all lengths.
- Calculate influence scores by taking weighted averages of rows in B connected to logit nodes (e.g. final prediction tokens).
- Perform "pruning" by removing low-importance nodes and edges, typically preserving 80-90% of total influence while reducing nodes to ~1/10th.
Attribution graph interactive demo
Global Addition Weights
https://transformer-circuits.pub/2025/attribution-graphs/static_js/addition/index.html?clickIdx=19085131
Neuronpedia Research circuit-tracerdecoderesearch • Updated 2026 Jun 25 13:28
circuit-tracer
decoderesearch • Updated 2026 Jun 25 13:28
Two-step reasoning (e.g., Dallas→Texas→Austin) actually uses intermediate holes. Language-agnostic reasoning followed by language-specific feature combination. CLT shows better replacement score/sparsity tradeoff compared to PLT, while skip PLT generally offers fewer benefits.
The Circuits Research Landscape: Results and Perspectives - August 2025
A multi-organization interpretability project to replicate and extend circuit tracing research.
https://www.neuronpedia.org/graph/info

gemma-2-2b Attribution Graph
https://www.neuronpedia.org/gemma-2-2b/graph
Attribution Graphs for Dummies - 1. What are Attribution Graphs?
Part 2: https://youtu.be/hdi1a9MjwDs
An introduction to attribution graphs from Anthropic's Circuit Tracing and Model Biology papers, featuring Jack Lindsey (Anthropic), Emmanuel Ameisen (Anthropic), Tom McGrath (Goodfire AI), and Neel Nanda (Google DeepMind).
0:00 Introduction
2:18 Attribution Graph Orientation
19:10 Analyzing an Attribution Graph from Scratch
40:25 Reflection: What have we Learned?
Explore Attribution Graphs: https://neuronpedia.org/graph
Blog Post: https://www.neuronpedia.org/graph/info
circuit-tracer GitHub: https://github.com/safety-research/circuit-tracer
Original Papers by Anthropic
- Circuit Tracing: https://transformer-circuits.pub/2025/attribution-graphs/methods.html
- Biology of an LLM: https://transformer-circuits.pub/2025/attribution-graphs/biology.html

https://www.youtube.com/watch?v=ruLcDtr_cGo

Jailbreaking with Prompt Injection
Interpreting Jailbreaks and Prompt Injections with Attribution Graphs
Yet the LLM at the heart of the agent remains a box that we never open. This is akin to a medicine that treats symptoms without understanding the underlying mechanism that causes them.
https://labs.zenity.io/p/interpreting-jailbreaks-and-prompt-injections-with-attribution-graphs

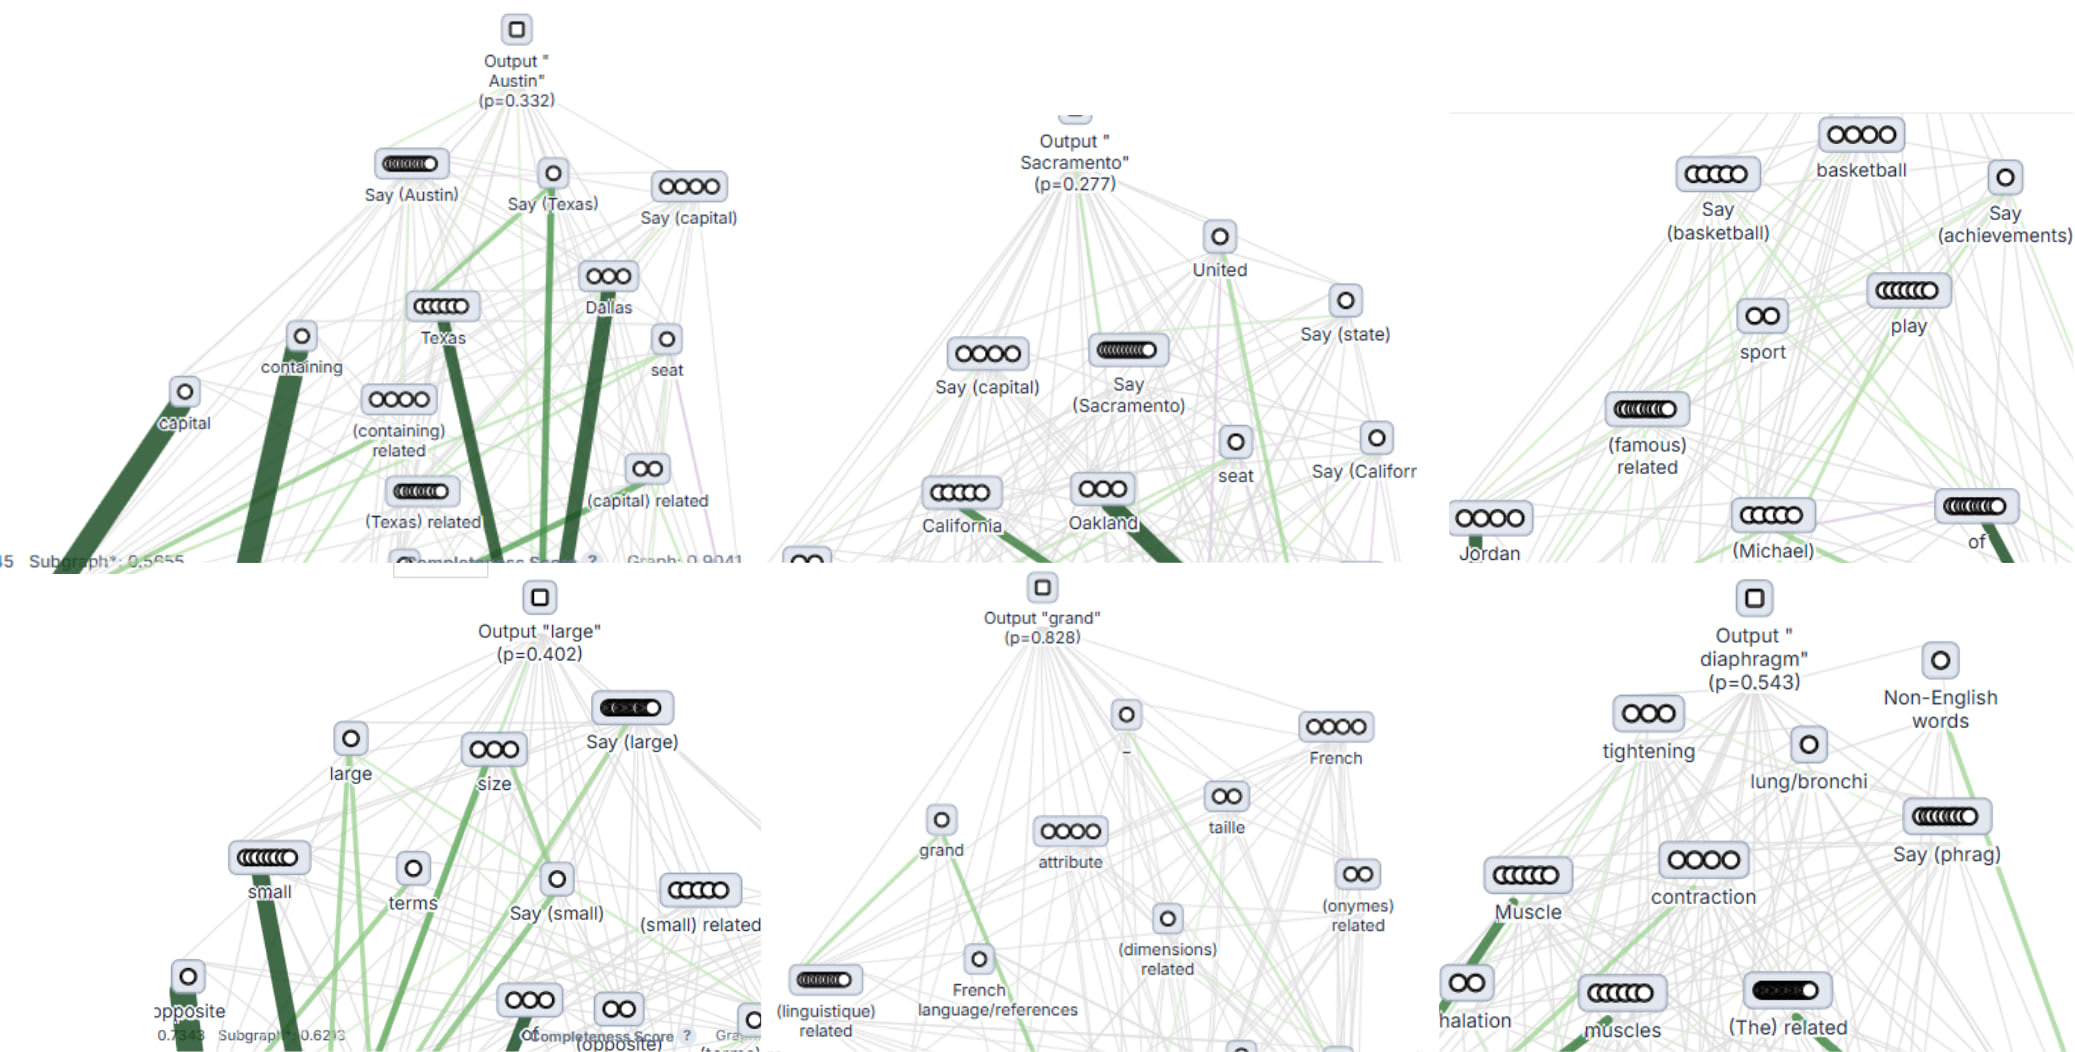
Automated Circuit Interpretation via Probe Prompting — LessWrong
Browse auto-genearted subgraphs on Neuronpedia: Dallas-Austin | Oakland Sacramento | Michael Jordan-Basketball Small-Opposite | Petit-Contraire | M…

https://www.lesswrong.com/posts/zQqGhKPqaCBZZDCge/automated-circuit-interpretation-via-probe-prompting
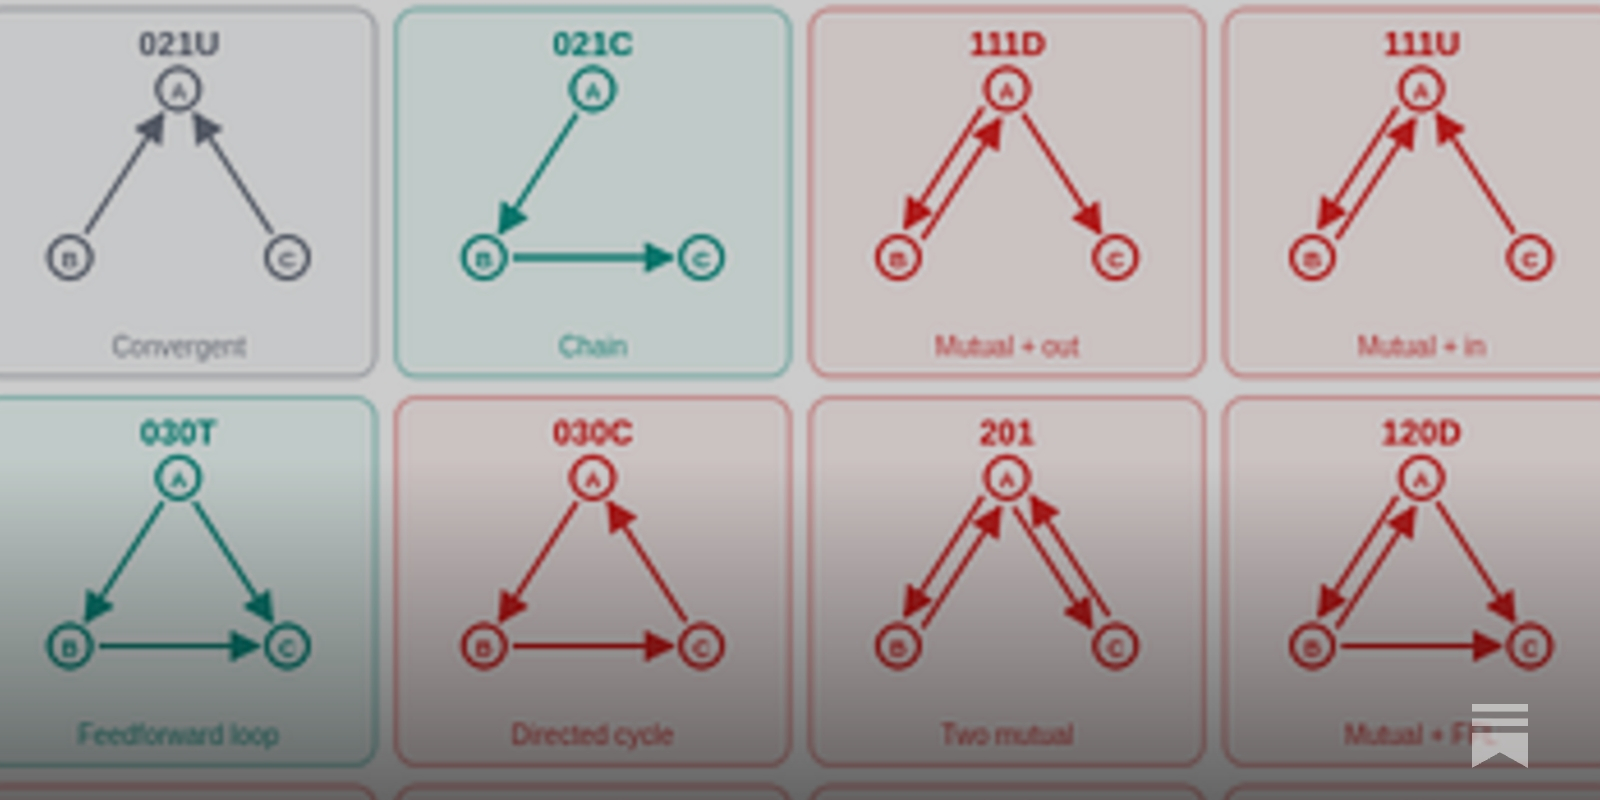
Network Motif Computational Motif
To automate attribution graph analysis, the tool circuit-motifs was created by applying network motif analysis from biology to LLM circuit interpretation. Analyzing 99 attribution graphs from Neuronpedia revealed that Feedforward Loop (FFL) structures overwhelmingly dominate in nearly all graphs. FFLs and simple chain structures are abundant, while cycle structures are nearly absent. Tracing individual FFLs reveals an actual step-by-step reasoning pipeline:
- Input concept extraction (grounding)
- Entity resolution
- Output competition and inhibition
Even with different models (Claude, Gemma, Qwen) or transcoder architectures, the FFL-centered pattern is largely preserved. Attribution graphs have a universal "structural grammar," which can be automatically summarized and compared through motif analysis.
Borrowing a tool from systems biology for mechanistic interpretability
TL;DR: I have been analyzing attribution graphs manually and found it to be tedious and hard to scale.
https://open2interp.substack.com/p/applying-network-motif-analysis-to